New Zealand - Demographic data & Analysis of the OIA Dataset
Following the release of massively confounded data, once again misinterpreted
The release of an FOI request1 (OIA - Official Information Act in New Zealand) has revealed imprecise data on deaths by vaccine doses.
The news was announced, on February 15, 2024, in a X post which went viral, by an anonymous activist, known on X as “Scoops McGoo”, who certainly deserves recognition, at least for his persistence to exploit the New Zealand data.
This post will as usual be too long for emails. It’s suggested to read it in-app or via web.
The data itself being deeply flawed, it has been misinterpreted by some “analysts” so far (understand “those who release analytics within a day of getting their hands on the dataset, are disregarding accuracy”).
It is still of some interest, as we try to highlight here. If only because such breakdown has proven very difficult to obtain, from our transparent western-occidental & austral democratic authorities.
After brief considerations on the seasonality of deaths, on demographic trends, and immigration, we detail the multiple confounders affecting the analysis.
We raise multiple concerns regarding data integrity, potential frauds, and alert signals. There is no direct “evidence”, except the complexities inherent in “real world analyses” of efficacy, complicating the interpretation of the data.
Impact of Seasonality & non-residents on Deaths
While comparing our reference file on deaths2 to the OIA data3, it’s worth noting, to illustrate a point we often had to make lately, that seasonality of deaths matters as people age.
Seasonality isn’t significant in New-Zealand, below age 65, as we can determine via a time series analysis for each 5 years age group, using Fourier terms (Perl, R).
The monthly raw deaths (including non-residents), <65 vs 65+, have been represented below, to illustrate this fact (Perl, R).
This above chart includes 1944 non-resident deaths over the 13 years covered (Perl), when compared with the “Residents only” deaths4.
Population Growth per Estimated Resident Statistics
The following chart illustrates the growth of the New-Zealand’s population, as per the December census5 official figures (Perl, R), between our period of interest (2019 to 2023).
Population Natural Growth & Immigration
The estimated resident growth should result, in good logic, of the natural growth & immigration (former yearly figures + yearly births6 - yearly resident deaths + yearly net 16 months-rolling immigration7 ) registered.
If we calculate this evolution and chart the evolution of the population between 2019 & 2023 (taking the December 2018 last census as basis), it results in the following:
There is an increasing offset between the Census reported figures & the Natural Growth + Net immigration, which can be visualized as follows:
Some uncertainty in the resident figures is regularly acknowledged by the NZ Census.
We will conclude that we know more or less how many residents are in New Zealand +/- 6k~ individuals and stick to figures we’re able to reproduce by age groups, for later analysis. A good part of this offset lays on births (3691 in 2021 for example - and will be of no impact on the approach we develop).
Immigration by Age Groups
It’s important, for perspective on further developments, to pass over the net immigration by age groups (as per OIA data, by 20 years brackets) for the recent years, 2019 to 2023 (R).
As illustrated on the above plot, the 2021 immigration is at a record low while the island is quarantined. The 20-40 age group & the 0-20 age group are then strongly going up - with a record high in 2023. Immigration in the two eldest age groups remains low in the last years.
Non-Resident Deaths Registered vs Deaths in OIA
These demographic parenthesis closed, it’s worth getting a look at the data integrity of the OIA data. An easy way to check the completion of the data communicated via OIA is to compare it with the Excel file published by stats.govt.nz, containing the same data without the “last dose received” breakdown (Perl).
Some rows in the OIA data have an “<5” total for privacy-protection purposes (whatever that means for “total of dead people”).. which I arbitrarily rounded to half (2).
There are more deaths (1552) in the OIA data than in the reference one - an offset which is still of 823 even if we would consider a “minimum of 1” for the “<5” entries in the OIA data.
Two elements are particularly annoying, between July 2021 & August 2022: Deaths appear to have been “reduced” in the official data in July & August 2021, and to have been “moved a month later”, in term of spike, in winter 2022, when compared to the previous figures we had.
Various explanations to the “total offset” have been considered. The rounding of “<5” introduces significant uncertainty. As advanced by David Hood, overseas deaths could also be counted in the OIA data.
But this wouldn’t explain the “one month lag” in 2022, nor the fact that most months are aligned - and these mysteries will require further clarification from the New-Zealand authorities.
During our discussion, another anonymous data scientist, Mongol_fi presented a comprehensive comparison across 3 datasets, which is worth looking at.
Under 20 Years Old & 0-20 OIA Deaths
Another important explanation lies elsewhere: in Stillbirths. I had pointed out on another New-Zealand-related issue that the local statistic services had issues writing simple queries. To understand accurately the issue, one has to compare the mortality among the 0 - 19 in the reference dataset, and the 0 to 20 mortality in the OIA dataset.
As observed, the number of deaths reported in the “reference” dataset are significantly lower (around half) than the deaths reported through the OIA dataset up to the end of 2022. However, after this point, the “reference” data surpasses the OIA data for deaths, indicating there’s a reporting delay or underreporting the actual number of deaths in the 2023 IOA data.
As far as the much higher figures, up to 2023, in the OIA data, the fact that the “20 years old” are not included in the Reference data above (as the OIA age groups are non-standard) couldn’t, of course, possibly account alone for the huge offset of deaths.
It’s therefore worth comparing specifically OIA yearly deaths against the Stillbirths8 & Under 19 deaths by Months in New Zealand, for the years on which we have complete data on both datasets (2020, 2021 & 2022). This comparison aims to gain further insights into the discrepancies observed in the OIA data.
We can, therefore, consider that at the very least, the OIA data includes stillbirths in the 0-20 counts (on top of the 0-4 deaths, from far the highest of this young age group). This is weird, as it doesn’t look to be the case over the previous 2019 period. It doesn’t even account for the entire offset, and it’s likely overseas deaths are also counted in the OIA data - as it seems, again, very unlikely that the 20 years old alone would account for the offset.
Adding to the flaws of the 0-20 age group:
the eligibility of the ages has evolved, integrating groups such as the 5-11.
the resident birth figures reported by New Zealand are unclear, with significant offsets between the datasets, with variations by several thousand depending on which table you look at.
Given these data flaws found in the 0-20 OIA age group, we can conclude this dataset is mostly irrelevant for analytics.
Limitations in reaching an accurate breakdown by age groups of the OIA data
The best we can reach regarding this point, in absence of matching age groups between the OIA data & the best “doses administered” official data we have, will be a guesstimate, given several severe limitations aside for those mentioned above:
Lack of annualized data - We should have person-days integrated in the OIA data to perform accurate estimates - but this data hasn’t, unfortunately, been asked or provided.
Lack of specific data - We don’t know when the people died or were vaccinated in each month. This prevents us from granular analysis, further than to consider that people dying on a given month were vaccinated at a rate corresponding to the “closest date from the 15 of this month”.
Difficulty in matching age groups - As we already mentioned, the age groups in the OIA data (by 20 years age groups) aren’t standard in the NZ statistics, which prevents to “directly match” these with the data, on doses administered for example.
Population data discrepancies - The population data for the years covered (2019-2023) is an estimate derived from the 2018 census, which doesn’t match perfectly the natural growth + immigration we can derive from the statistics (+/- 6K+ persons).
Data scope-related issues - The population data only includes residents, while OIA deaths & NZ doses administered data include non-residents. This bias will negatively impact the “never vaccinated” if we consider that “never vaccinated = population - at least one dose recipients”, by reducing the “never vaccinated” real population, while inflating their deaths. This phenomenon will be reinforced if we consider that the New Zealand authorities may not have had access to the accurate number of doses for these foreigners’ deaths.
Data matching issues - It’s unlikely that each record of death in New Zealand has been perfectly matched to the corresponding vaccination records (missing or faulty social security numbers, married women harder to reconcile, etc.), and this, again, would impact negatively the “never vaccinated” group by adding vaccinated deaths to their toll - as it has been highlighted in various countries.
Impact of immigration - New Zealand has experienced a significant influx of immigration in 2023 - and they would tend to add to a healthy, vaccinated population.
The evident “practical limitation” here is, of course, the non-matching age groups between doses administered & OIA data. To make-do as best as we could with this obstacle, we:
Evaluated the coverage between age groups in New-Zealand, concluding, as exposed below, that it would be quite uniform.
Applied, inside of these age groups, a normalization to the % of population covered to reach “persons with at least one dose, by age groups” as accurate as possible.
Total of First Doses administered by dates
The dose data with breakdown by age groups isn’t available before 2021-08-31 on the NZ Git repository9, which deprived us of data on the first big wave of vaccination. We went around this limitation using a scrapper (Perl) to fetch the data from health.govt.nz’s webpage, via archive.org (thanks to David Hood for the info).
The first doses data by age groups from these two sources, have been merged (Perl) in a .CSV file (discarding “Various” doses - 2249 doses on the last date, May 3, 2023).
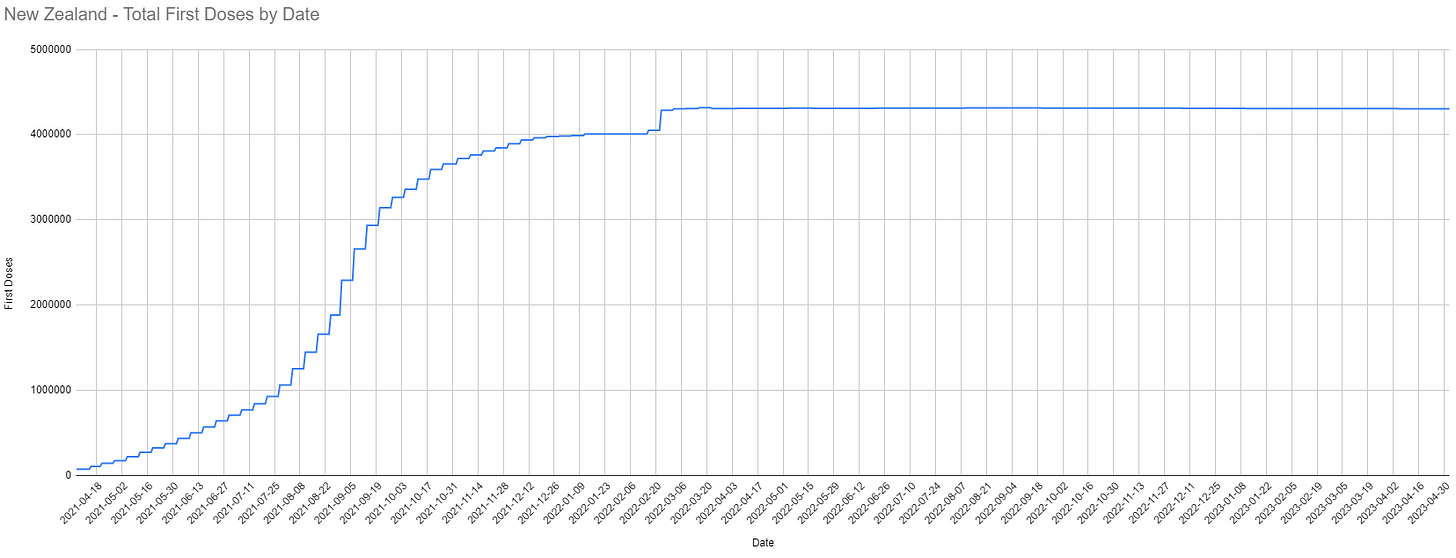
The first doses administered are represented below, illustrating that after February 2022, the first dose administrations were “completed”.
The jump in February 2022 raises question. It seems at first sight to correspond to political measures, allowing people fully vaccinated to enter New Zealand and self-isolate, rather than enter managed isolation and quarantine (MIQ) facilities10.
In any case, a first look at this chart shows 2 distinct periods:
From April 2021 to end February 2022: vaccination campaign. We should observe equal death rates among the two cohorts, as COVID only strikes in June 2022. Eventual offsets in favor of the “vaccinated” being a combination of Healthy User Bias (or HVE), and of non-reconciled reports aforementioned.
From March 2022 to December 2022 (and eventually forward): post vaccination campaign, where the cohorts aren’t moving anymore.
Percent of age groups ‘Ever Vaccinated’ in New Zealand end 2021
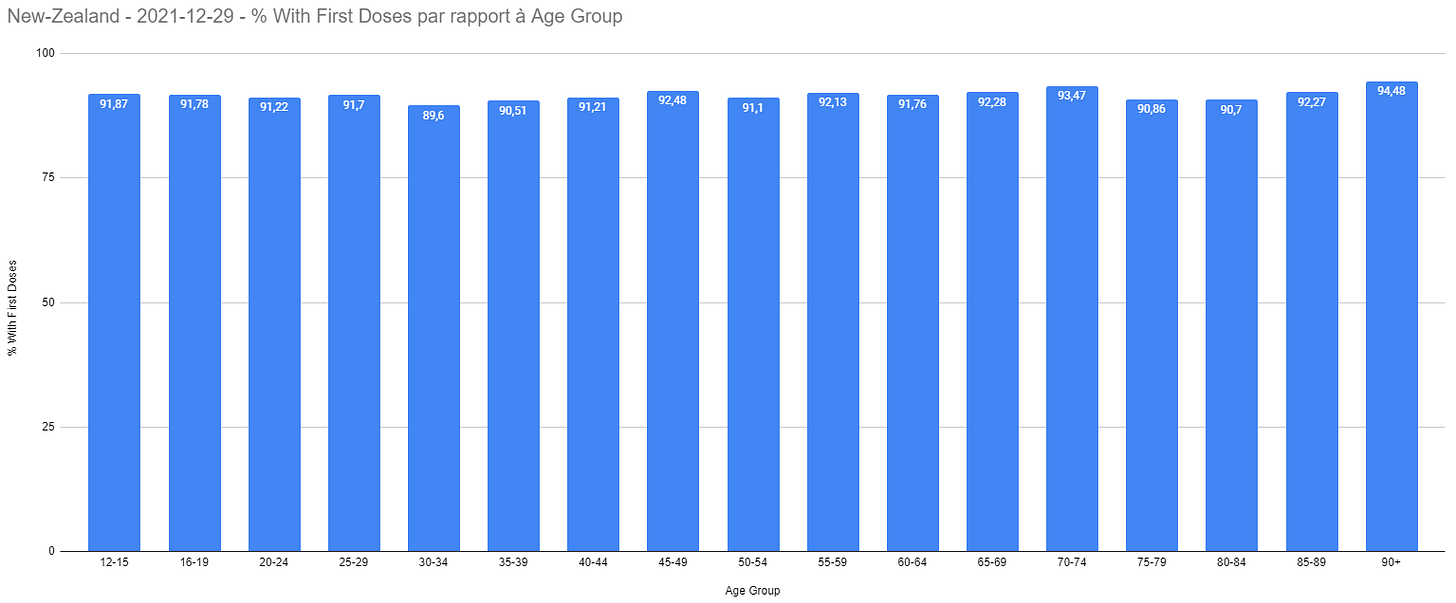
Being able to account adequately for aging of the population involves evaluating the “Age group coverage percents”, as of the nearest date to end 2021 (2021-12-29), compared to the December 2021 population (Perl) derived from “2018 census + natural growth + net immigration” - which as mentioned above fits at +/- 6K~ the census data.
These rates are represented below.
There are minor discrepancies, but in any case, the increase of coverage through ages is in no case as observed in other countries such as Sweden, increasing significantly with age. We therefore assumed an equal coverage for each age, inside of each age group, as the doses were administered in these age groups through time.
Ever-Vaccinated vs Never-Vaccinated Populations by OIA Age Groups
At this stage, we can reach approximate, yet relatively precise, evaluation of the evolution of the never-vaccinated against ever-vaccinated in New Zealand, by OIA age groups, for the periods we wish to study. The populations evolution, with cut-off on December 31, 2021, would look like the followings (Perl).


It’s worth noting that the figure for first doses administered aren’t, always, entirely logical. For example, on March 16, 2022, there were 35,055 first doses administered in the 90+, but on March 23, 2022, we have only 30,671, a reduction difference of 4,384 doses. Similarly, on March 10, 202211, there was a significant decrease (-40,562) in the first doses received aged 5 to 29 compared to the previous total on March 3, 202212 (Perl).
It’s also at this time that the “Booster 1” breakdown was introduced in the statistics, and it’s likely that erroneous “First Doses” were reclassified as “First Boosters” at this time. A user on X discussed the possibility that changes in calculation rules would have introduced the discrepancies - and makes interesting points, but these explanations aren’t corresponding to symptoms we describe below.
Another “amusing” discrepancy is that New Zealand keeps jabbing more elderly than there are left to jab. On February 16, 2022, we had 2,467 potential “unvaccinated” in the 90+. On this date New Zealand claims to have jabbed a brand new 3,525 (although the offset is later rectified). In any case this illustrates that mis-categorization of dose administered as “first dose” was common. A similar point was made, a few hours ago, by Joel Smalley, in this article reaching a similar conclusion regarding the OIA data, with a different method13.
From 2021, 2022’s ever & never vaccinated populations have been generated, accounting as best as we could for Natural Growth, Net Immigration & Aging of each of the two populations (Perl - 2022). The 81+, immediately below, is of interest as we will develop.
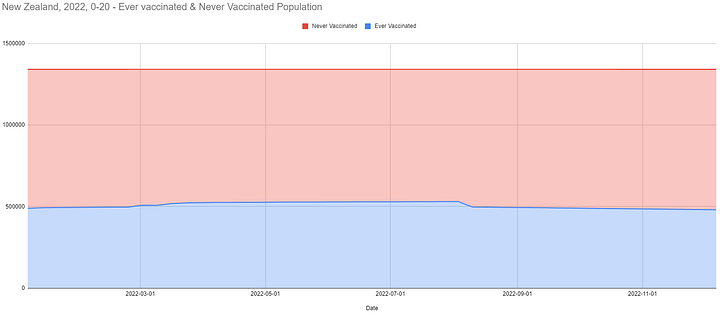


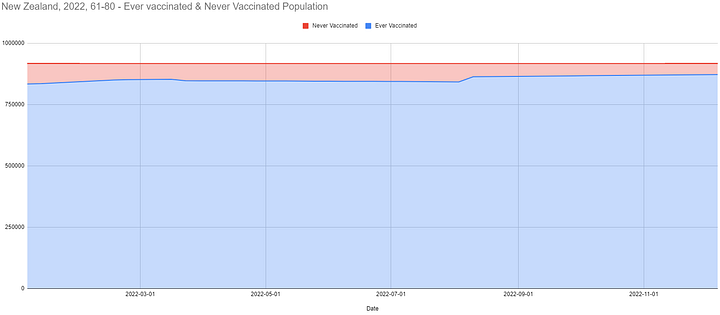
It’s particularly problematic to see the 81+ (and the 61-80 in a lesser proportion) suddenly massively “de-vaccinated” prior the 2022 borders opening & Covid wave. This highlights a suspicious pattern in the data where the older age group experienced a decrease in vaccination rates. It’s not imminently obvious when looking at the global total doses administered as they are hidden by a sudden move of first dose in “youngest vaccinated”.
This certainly doesn’t look like a booster mis-classified, and a lot like some politician, about to reopen its border with a near 100% vaccinated in the elderly we can observe early March, didn’t want some vaccine to show really shitty results, hence defrauded her figures to artificially reduce the number of vaccinated elderly “to the benefit” of the 0-20.
For perspective, let’s recall another chart I was presenting on New Zealand a short time ago14. The period concerned is the one with a big red spike.
Anyway, if we repeat the operation for 2023 (Perl), we now have an overall decent appreciation of the population ever & never vaccinated, covered by the OIA period - without incident worth detailing this time as anyway the doses data stops on May 3rd.
At this stage, we can perform the following evaluation of the death rates among the population ever vaccinated & never unvaccinated, on each month (using the nearest from the 15 of each month’s data-point), by OIA’s age groups (Perl, R), for the periods we wish to study. Given that we are dealing in approximates and that annualized data (using person/years) wouldn’t impact perception on monthly offset in death rates between the two populations, we have kept normalization per 10.000 persons. For example, the following chart illustrates the death rates by age groups 21-40 (with the population evolution as stacked area background).
So, have we proven the effectiveness of the vaccine? Not exactly. Instead, we have have reaffirmed (as mentioned earlier in this article) the poor quality of data integrity in New Zealand.
Evaluating mis-categorization Rate in 2021
The 0-20 age group being, as we reviewed, heavily confounded, we have at least the 21-40 & 41-60 age groups, in 2021 (year without COVID in New Zealand), who aren’t affected by seasonality.
Unidentifiable HVE aside, we would expect to see equal death rates among these two ever & never vaccinated cohorts - with a number of subjects far above the requirements, in each cohort, to remain statistically relevant over the course of 2021 (R). Unless the COVID-19 vaccine is now claimed to be a protection against all-cause mortality from random hazards of life.
The following charts are zooming on 2021 for every OIA age groups.
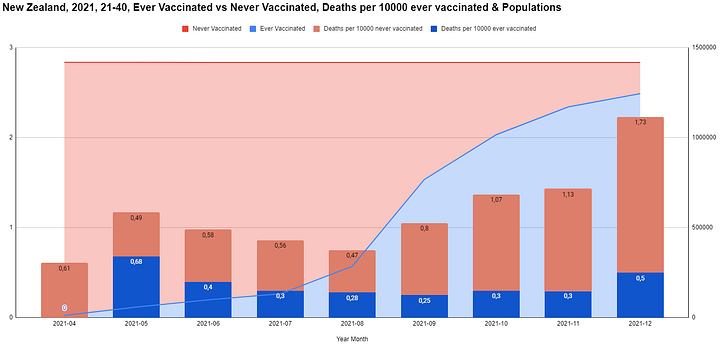


Aside for a very visible spike in deaths in vaccinated in the 0-20 as the shots were rolled out, it’s visually quite obvious that the COVID vaccine, before COVID runs on the island, shows tremendous protective effect.
This is of course related to the numerous problems of data integrity aforementioned. On the assumption we should observe near equal death rates among both groups, we can compute a mis-categorization rate for each group & the relevant months (May 2021 to January 2022).
The mean mis-categorization of vaccinated to unvaccinated deaths is 26.7% (min. 2.9% - max 59.6% - median 17.8%) (R).
Of course, we could adjust for this mis-categorization rate and explain why the Winter 2022 was a tremendous disaster for the vaccinated - despite all the bias weighting on the unvaccinated group - and the suspicious rate of persons “lost in first doses” we already mentioned.
But it would be contrary to our current argument against mis-using bad data, and twisting it to make it fit your confirmation bias.
Instead, we will once again ask for transparency, and that the New Zealand authorities produce the efforts required to ensure the integrity of the data they use to interpret the success of their health measures.
Once more, thanks to the researchers, from all “perspectives”, who contributed to improve this article prior release with their precious comments.
OIA 25021, on fyi.org.nz
infoshare.stats.govt.nz, Population → Group: Deaths - VSD → Table: Deaths by age and sex (Annual-Dec)
Sex : Male, Female
Observations : Less than 1 year → 100 years & over
Time : 1999 → 2023
infoshare.stats.govt.nz, Population → Group: Population Estimates - DPE → Table: Estimated Resident Population by Age and Sex (1991+) (Annual-Dec)
Estimate Type : As At
Population Group : Male, Female
Observations : 0 → 94 years old, 95 & over
Time : 1991 → 2023
infoshare.stats.govt.nz, Population → Group: Births - VSB → Table: Live births by age of mother (Annual-Dec)
Age of mother : Total all ages
Time : 1987 → 2023
infoshare.stats.govt.nz, Tourism → Group: International Travel and Migration - ITM → Table: Estimated migration by direction, age group and sex, 12/16-month rule (Annual-Dec)
Travels Direction : Arrivals, Departures
Age Group : 0 years → 89 years, 90 years & over
Sex : Male, Female
Estimate : Estimate
Time : 2002 → 2023
infoshare.stats.govt.nz, Population → Births - VSB → Table: Live births (by sex), stillbirths (Maori and total population) (Annual-Dec)
Live Births, Stillbirths : Stillbirths
Ethnicity : Total
Time : 2019 → 2023
from the minhealthnz’s GitHub’s DHB residence uptake files, for example github.com/minhealthnz/nz-covid-data/blob/main/vaccine-data/2021-08-31/dhb_residence_uptake.csv
github.com/minhealthnz/nz-covid-data/blob/main/vaccine-data/2022-08-03/dhb_residence_uptake.csv, sum of the “At least partially vaccinated” in age groups 5-11, 12-17, 18-24, 25-29 = 1 390 590
github.com/minhealthnz/nz-covid-data/blob/main/vaccine-data/2022-01-12/dhb_residence_uptake.csv, sum of the “At least partially vaccinated” in age groups 5-11, 12-17, 18-24, 25-29 = 1 350 028


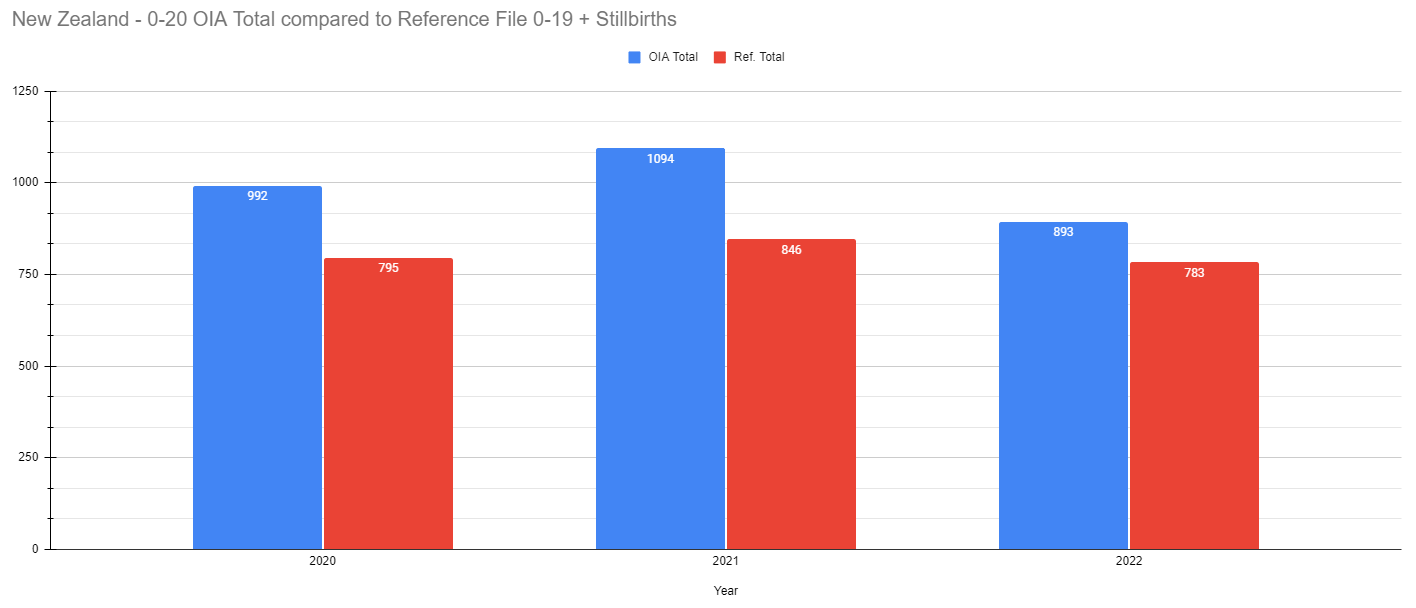


In the dataset for monthly deaths by registration date, I think the deaths probably peak in August 2022 and not July 2022 because of a registration delay. The deaths peak in July in a dataset for monthly deaths by date of occurrence at Infoshare: https://twitter.com/mongol_fi/status/1759489040255001054/photo/1. The dataset is here under "Population > Deaths (VSD) > Month and year of death (Monthly)": https://infoshare.stats.govt.nz/.
The reason why the OIA response has a lot of deaths missing in 2023 in ages 0-20 could be because younger age groups have a longer registration delay than elderly age groups. The ONS has published a dataset about the impact of registration delay on mortality statistics: https://ons.gov.uk/peoplepopulationandcommunity/birthsdeathsandmarriages/deaths/articles/impactofregistrationdelaysonmortalitystatisticsinenglandandwales/2021. In sheet 10 the spreadsheet included with the dataset, for example for deaths in ages 1-14 registered in 2021, 15% of deaths had a registration delay of over a year and 12% had a registration delay of 6 months to one year. Sheet 2a also shows that deaths from external causes have a long registration delay on average, but deaths from external causes account for a large proportion of deaths in ages 0-20.
You wrote that "OIA deaths & NZ doses administered data include non-residents". But how do you know that the OIA includes non-residents?