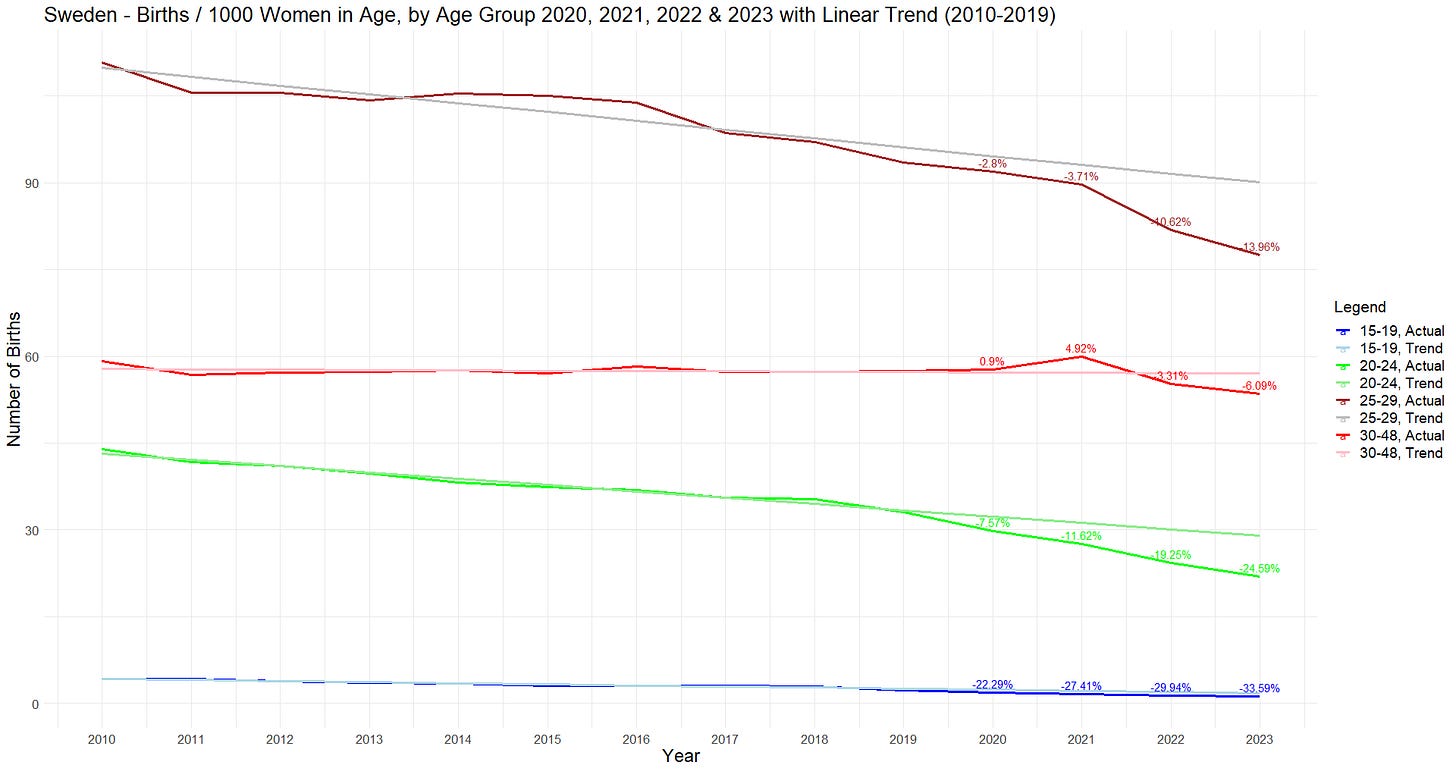
This will be a quick update to my recent article on the topic1, following the release of the 2023 figures. It will simply involve changing a few inputs in the already written code to provide an updated analysis of birth rates by mothers' age groups.
A longer article will follow over the weekend, focusing on New Zealand's latest Freedom of Information (FOI) data.
For some global considerations when compared to the 2010-2019 baseline, Z-score & deviation to linear trends are the following (the “Deviation from linear trend” being the number of babies you would have expected to be born).
2020 - Z-score: -1.040018, Deviation from linear trend: -3006, Percentage of deviation: -2.589471%
2021 - Z-score: -0.287173, Deviation from linear trend: -2069, Percentage of deviation: -1.778172%
2022 - Z-score: -6.335957, Deviation from linear trend: -11846, Percentage of deviation: -10.161431%
2023 - Z-score: -9.308615, Deviation from linear trend: -16778, Percentage of deviation: -14.361058%
Sources
Data on births comes from this table.
Region : Sweden → All Sweden
Age of the mother : “Alder, 1-arsklasser och 2 grupper” → Select all
Sex : men, women
Year : 2000 → 2023
Save results as → CSV with headings.
Data on women’s population & marriage comes from this table.
Observations : Population
Region : Sweden → 00 Sweden
Marital Status : Select all
Age : Age, 1 year age classes → Select all
Sex : Men, Women
Year : 2000 → 2023
Save results as → CSV with headings.
The useless first 2 lines are removed from the resulting .CSV files.
The code & raw files used are available on GitHub.


Diagrams in monthly resolution. In this model, deviations differ by ca. 3%. https://substack.com/profile/124421064-ulf-lorre/note/c-50293109
This is very interesting. 2023, a Z score of -9.3, bloody hell!
I have consistently maintained that the experiment being run in Sweden bears no resemblance to the experiment being run Down Under, while there appears a recent suggestion of convergence.
https://drlatusdextro.substack.com/p/gell-mann-amnesia